Plots
The plots category lets you control the "Data Visualization" tab in the editor, letting you graph data in various types of plots.


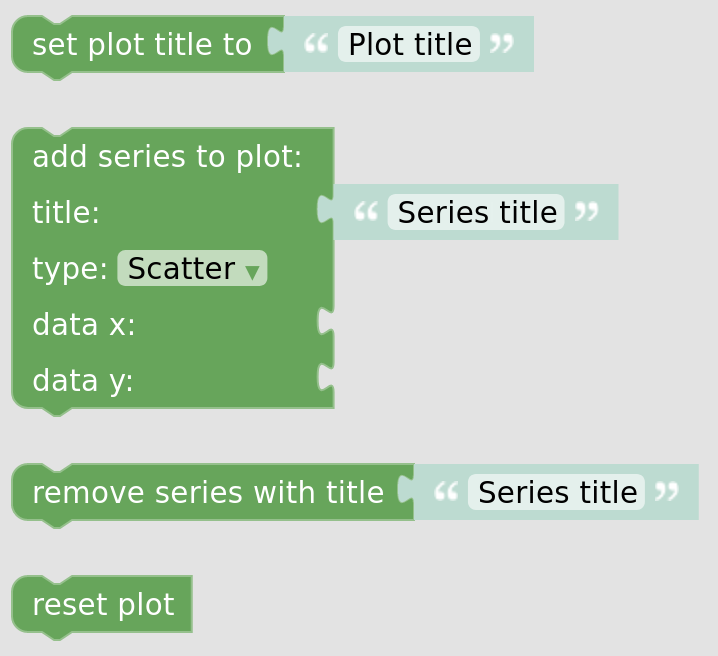
Set plot title
This sets the title of a plot. This is different from the series title, which is used to differentiate multiple series.

Add series to plot
This is used to add data to the plot. The title is displayed on the right side of the plot when there are multiple series, allowing you to differentiate them. Both data parameters should be lists.
Types of plots
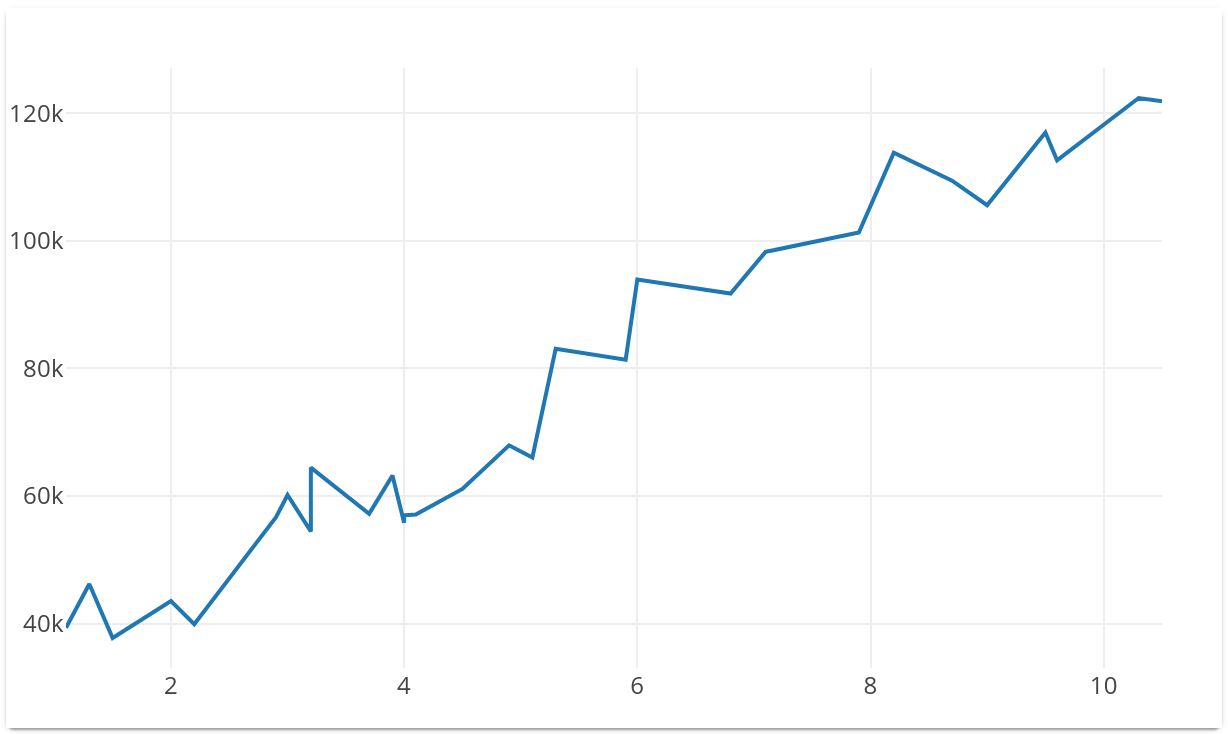
Here are the types of plots we currently support:
If you'd like us to add support for a new type of plot, feel free to file a GitHub issue suggesting it.
Remove series with title
This removes a series by its title.
Reset plot
This resets the plot (removes all series and clears the title).